Swim Lane Diagrams:
Five ways they can optimise your business
Agility System | 23.03.2021
If you’re looking for ways to make your business processes more efficient – whether you’d like to save money, time or the headaches of those involved – you need to get a good idea of what’s going on.
The best place to start is with a simple overview, but written checklists and procedures can only get you so far. You need something visual to map the tasks, teams and people or processes involved.
Swim lane diagrams are almost always a great introduction – bringing transparency, accountability and, ultimately, driving efficiencies from top to bottom.
01
What is a Swim Lane Diagram?
A swim lane diagram, also called a cross functional flow chart or swim lane process map, is a simple, visual representation of a business process and all the sub-processes that contribute to it and in what order.
Swim lane diagrams make it clear and easy to communicate complex principles on a more intuitive visual level – distinguishing all the capabilities, roles and responsibilities that contribute to your business’s workflows so you can get a quick snapshot of what’s involved, when and where.
02
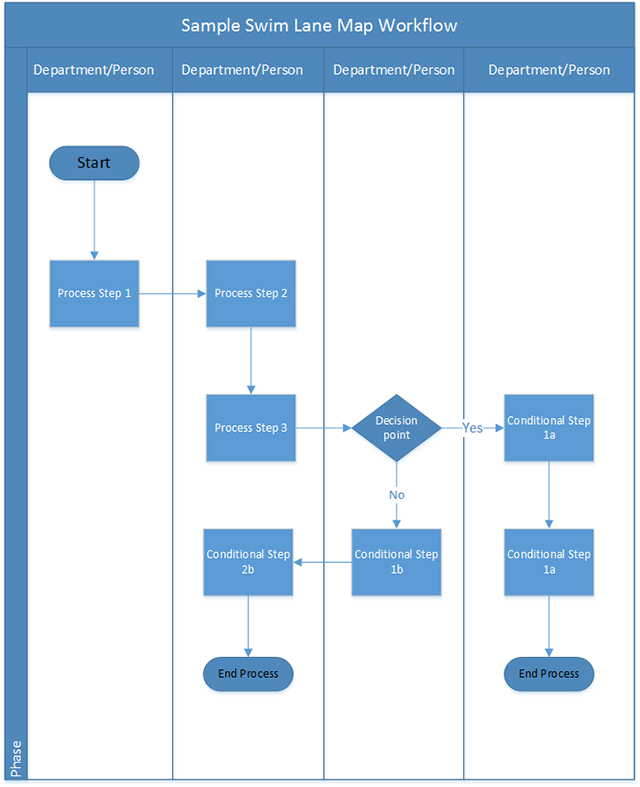
What does a Swim Lane Diagram look like?
Parallel vertical lines divide the chart into lanes (hence the name), with one for each person, group or sub-process. This method gives you a comprehensive understanding of how organisational roles, decisions and processes interact to affect certain outcomes.
Swim lane maps and diagrams are a popular approach to business process mapping because they provide several clear benefits. Here’s five of the main ones.
03
Swim Lane Diagrams clarify complex processes
Organising processes into swim lanes can provide easy visual representations for even the most complex of relationships.
Text-based explanations can be hard to follow (and easy to ignore) but, when it’s all laid out clearly, it’s much simpler to identify and organise bottlenecks, inefficiencies, responsibilities and relationships.
04
Swim Lane Diagrams improve understanding and communication
Whether it’s improving production times, installing a new computer system, or on boarding new hires, setting up a swim lane diagram involves a process of discovery around decision-making – whether it’s top executives or general labour.
Each process is segmented into a series of tasks, which all lead to a desired result, so everyone can clearly see what their responsibilities are and how they affect others as well as the overall workflow. It’s a visual reference so that anyone can easily answer questions such as “What happens now?” or “Who is supposed to take care of this?”.
05
Swim Lane Diagrams identify participants
Working out who does what is important for both current and future initiatives. This should include each organisational unit in the sequence of tasks, as well as any source of input such as documents, data, or approvals. Anyone receiving any output from the process should also be identified, such as vendors or even computer systems.
While diagrams can be constructed at any level of detail, in-depth swim lane diagrams will reveal steps where additional help or skills are needed or where teams can be trimmed, or if people are being over-worked or under-used.